Activating knowledge graphs for data management applications offers a powerful way to enhance both analytical and operational processes. By unlocking the relationships between data assets, business metadata, and inferred connections, businesses can derive actionable insights, streamline compliance efforts, and build resilient, automated pipelines that adapt to changes over time.


The active knowledge graph has become a staple in modern data management over the last couple of years. Virtually all new data architecture concepts use active knowledge graph and metadata activation to support basic data governance and documentation and drive automation. Active metadata has become even more important in recent years due to newly increased prominence of new AI concepts such as generative AI.
In this article, we are going to explore how an active knowledge graph leads to tangible business outcomes and how this concept can drive efficiencies and automation in your organization.
To explore possible business outcomes, we first need to understand what a knowledge graph is and where it sits in your architecture. Knowledge graph is not a new concept. In fact, it has been used for data-related applications and search engines such as Google Search, scientific question-answering services like Wolfram Alpha, and to support reasoning layers for digital assistants such as Siri or Alexa.
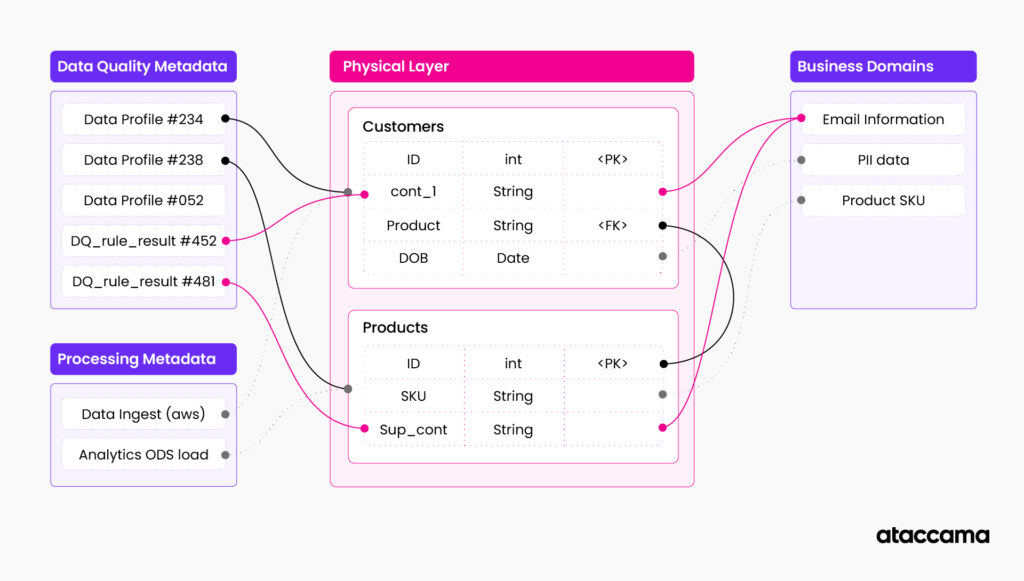
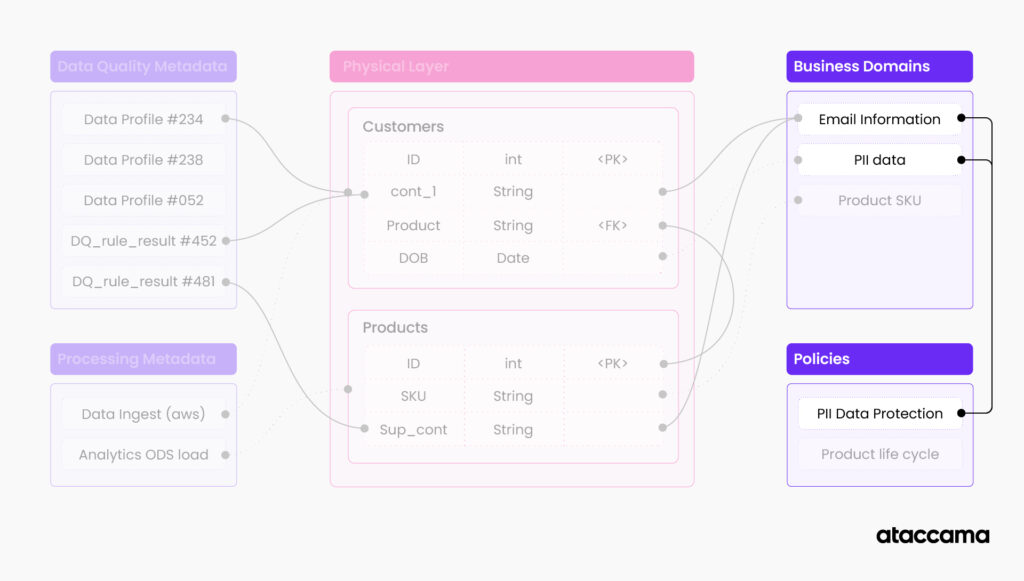
In general, a knowledge graph is a knowledge base that stores relations between your data entities and semantic concepts in a graph structure. In data management applications, a knowledge graph represents a documented description of your data assets. These are data models connected to your business domains, data processing systems, and reports. There is often additional metadata attached to your data assets, such as data profile information or data quality scores.
Example: Imagine your customer data table documented in a knowledge graph. You have physical data structure, attributes, data types, constraints, and relationships to other tables. The knowledge graph also stores relationships between your data structure and business domains. For example, column “cst_cntact_1” is related to the domain “customer email,” which basically indicates that there is email information in this column. Then you have information about processing also related to the table, i.e., airflow and scheduler configuration are related to this table, indicating that the table is used in this specific processing pipeline. You can also have information about the current data quality and profile of the table and its columns attached as additional related metadata. You can add relationships to policies affecting the table, restrictions, reports, etc.
To better understand different types of metadata that can be stored in the knowledge graph, let’s look at the example of how the graph is created.
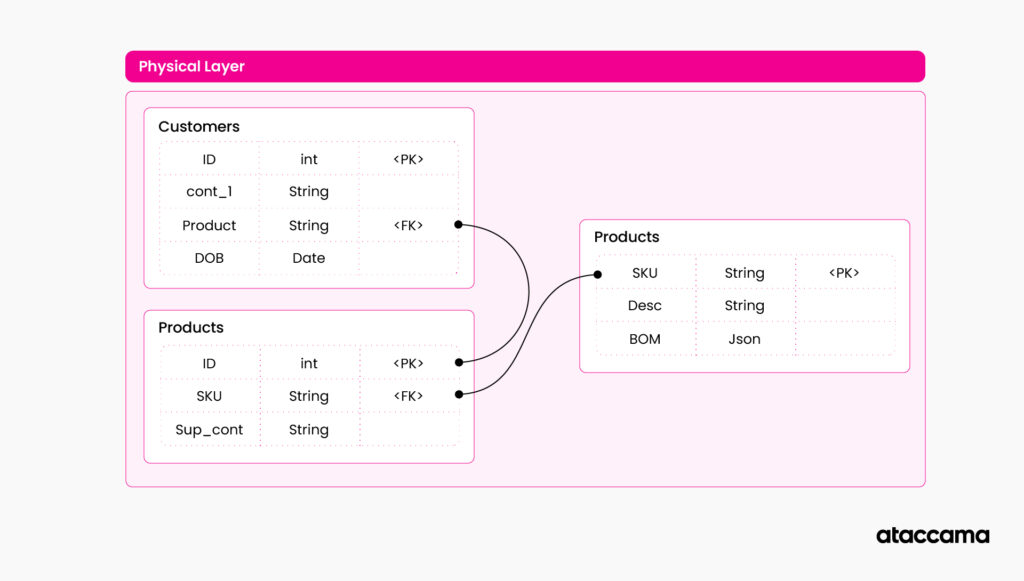
Let’s imagine that you are tasked with documenting the data landscape of your organization. You often start with a base layer of technical metadata such as table structures, data types, and table/attribute relations. These are part of your data management systems (RDBMS, object storages, etc.). It is generally in the control of your IT organization or department that is responsible for data infrastructure. These systems often have very well-established ways of extracting and managing this metadata information, and there are various automated ways to export this information to knowledge graphs. This is a base layer of your metadata knowledge graph, often sitting in your data catalog.
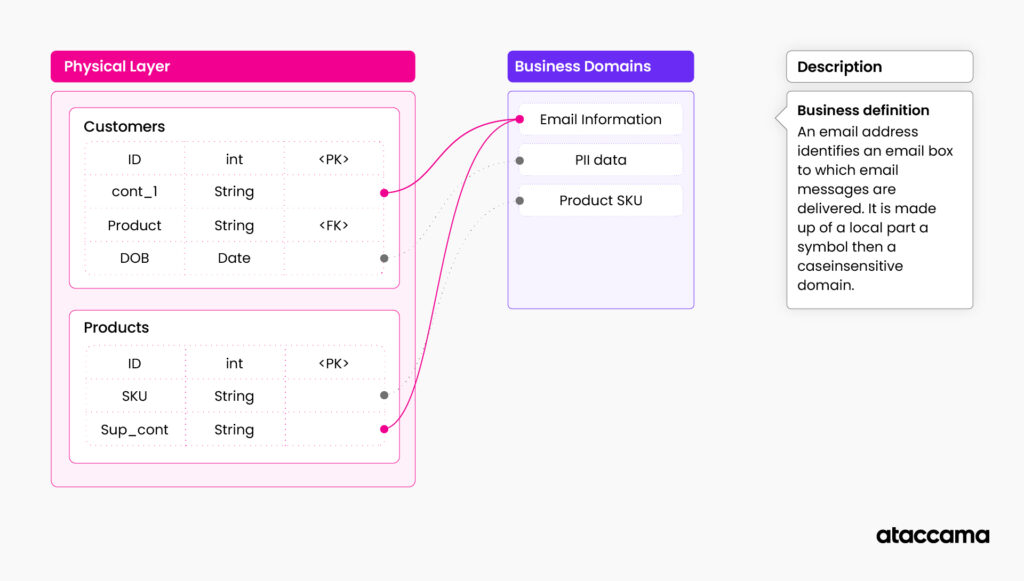
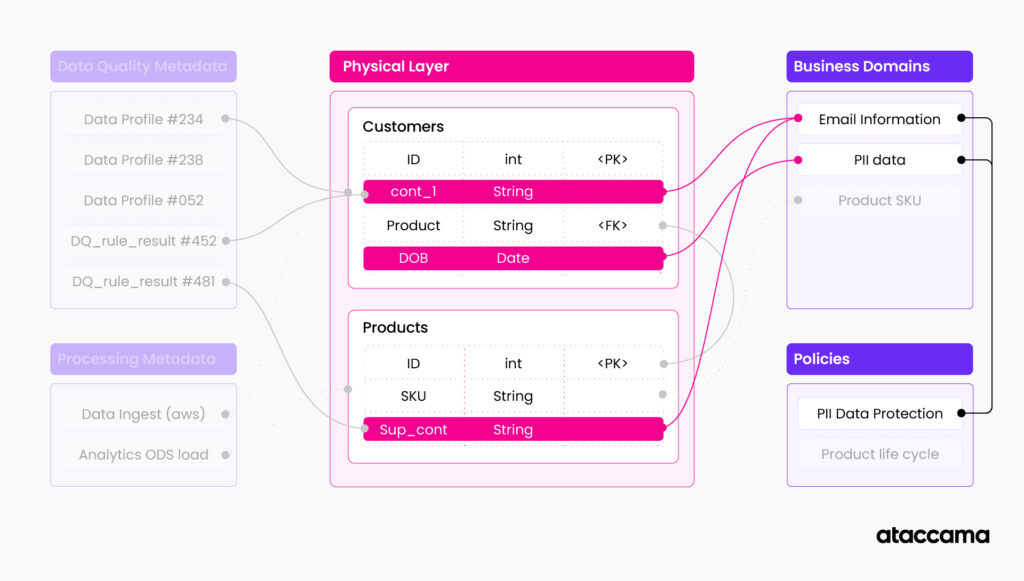
Next, you can document your business metadata in a glossary and connect it to your base layer of technical metadata. As the name suggests, “business” metadata is often owned by subject matter experts coming from business units across the enterprise.
These can be table and column descriptors, data domains, or regulatory indicators. For example, a business domain can be something as generic as “Customer contact information” or “PII data” or company-specific such as “Product code”. Subject matter experts understand the structure of business glossary, the importance of different domains and how they relate to each other, how they relate to data, and what regulations apply.
This creates an additional semantic layer of your knowledge graph and provides a better understanding of what the specific data assets are intended to be used for. Business metadata can be partly inferred, but often attaching business metadata to technical metadata requires approval from data owners and subject matter experts.
Relating business metadata to the base physical layer is one of the most labor-intensive tasks in the knowledge graph creation process. This is where data catalog systems with automation and classification options (often supported by AI models) demonstrate their value.
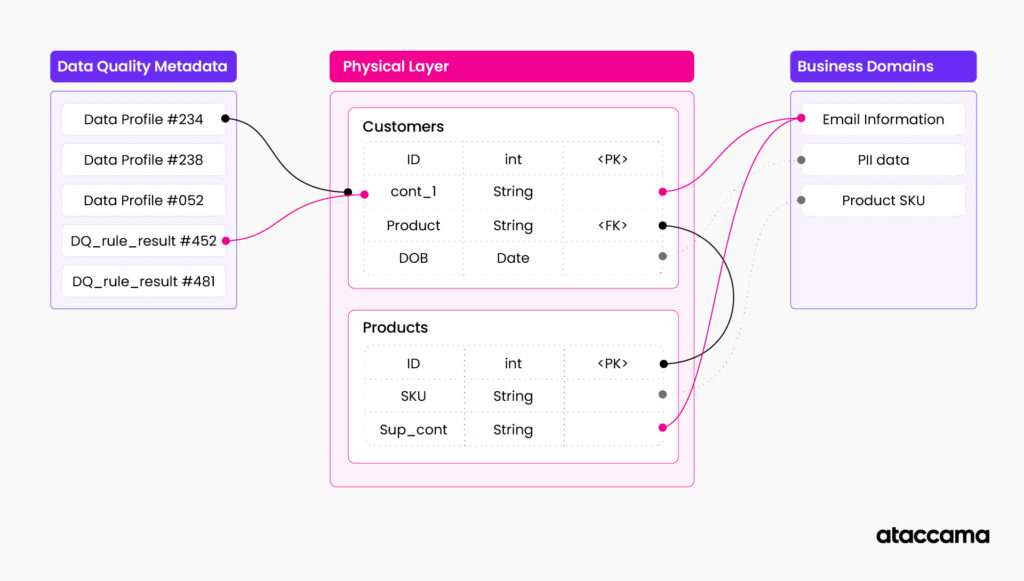
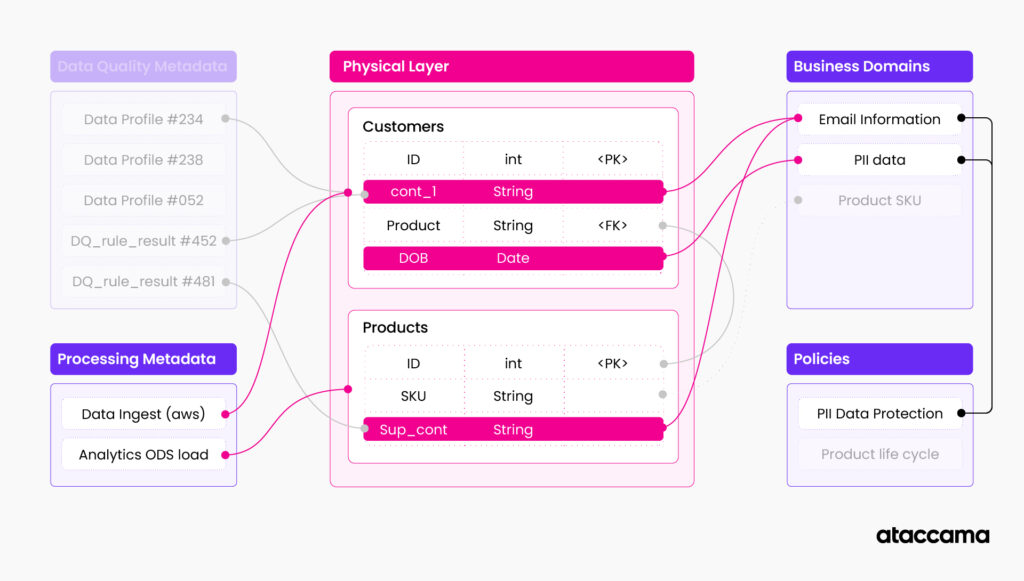
Inferred metadata is the next layer that is present in the knowledge graph. This layer is often the first example of “active metadata” usage of your knowledge graph. Inferred metadata are created by analyzing underlying data and metadata structures and adding additional information to your knowledge graph. This layer is more fluid and requires regular refresh and re-calculation. The line of what can be considered inferred metadata is constantly moving as new automations are added to the data management stack.
Here are some examples of inferred metadata:
One of the new additions to the knowledge graph is a fast-changing metadata layer represented by data usage statistics, data processing logs, and data in motion information. This is often changing in near real-time and is the most volatile part of the metadata knowledge graph.

All together, a knowledge graph represents constantly changing and evolving information about your underlying data and data infrastructure.
Graph databases are often used as storage and analytical layers for the knowledge graphs. In fact, the graph database concept was originally created for this specific purpose. These technologies provide a lot of built-in functionalities and graph query language that are very useful for running knowledge graph analysis during its activation. Useful information combining multiple layers and traversing multiple relationships can be obtained by running two or even a single query against a knowledge graph stored in a graph database. Although very useful in such scenarios, graph databases are actually not always needed to manage knowledge graphs. Especially in enterprise applications where stability and predictable performance are key, a lot of data management solutions opt out of different technologies or employ a tiered approach using standard RDBM solutions combined with high-performance indexing systems.
Now that we know what the knowledge graph is and what it contains let’s look at how we can leverage this information in the data management concept. We call this “activating” the knowledge graph.
We will explore two ways to leverage the knowledge graph: analytical use and operational use. Where analytical use cases are often ad-hoc and used for exploration and quick iteration, Operational use cases integrate knowledge graphs into repeatable operational processes. Both use cases often activate the knowledge graph in similar ways.
Answering questions is the original purpose behind the knowledge graph concept and that is exactly what it is used for in analytical use cases for data management applications. In these use cases, data scientists, subject matter experts, and expert systems are exploring the knowledge graph in search of answers to data management and governance questions.
Examples:
Let’s explore what happens when you “ask” the question:
Imagine a knowledge graph with all the data assets, business metadata, and inferred metadata, as well as all the relationships between them that we created in the previous section.
Let’s ask the question:
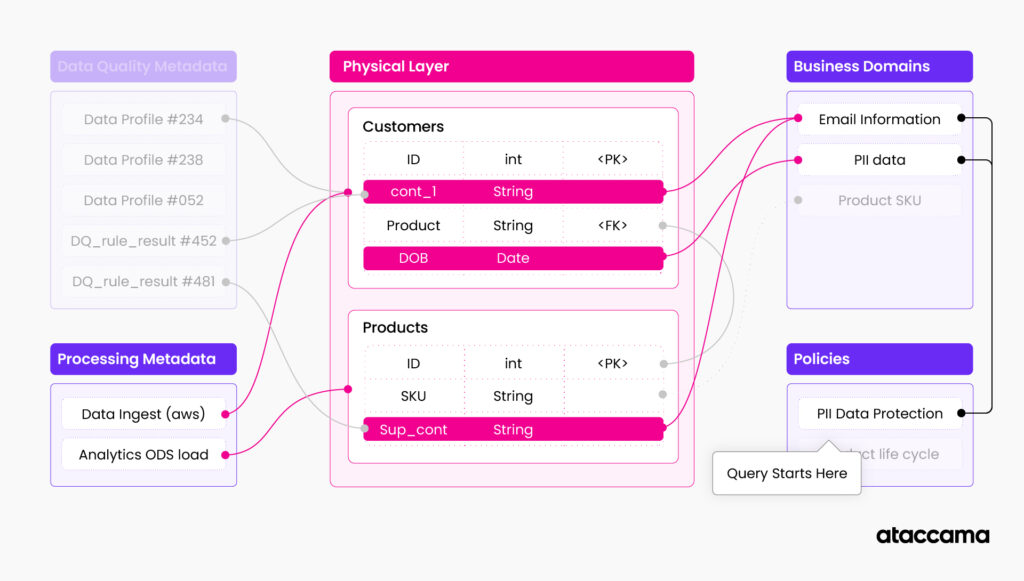
“Which tables in my data landscape have sensitive personal information that was not accessed in the last 6 months”.
First, parse the question, imagine what queries we need to perform:
Activating a knowledge graph is equivalent to searching and highlighting specific paths along the relations between different entities. This is very similar to querying a large data warehouse with a very normalized data model. Having all that information in one place and automatically updated over time is what makes this solution very powerful. The more interconnected and information-rich this solution is, the more useful it is.
Operational use cases leverage the ability of the system to consistently answer analytical questions and use the answers to orchestrate automated processes. This approach is often overshadowed by analytical use cases because of the lower barrier to entry and less effort required to deliver value. Analytical use cases are often used as testing grounds for operational use cases, as operationalizing analytical use cases often provides better long-term value.
This type of operation is usually managed by more technical users such as data engineers and requires mindset change compared to traditional data engineering approaches. This results in higher process resiliency, faster time to value for rolling out new initiatives, and process optimization.
Examples:
Example: self-healing data pipeline
Consider previously explored analytical use case (tables with sensitive personal data that were not accessed in the last 6 months). Now imagine we want to use the same approach to feed data from these tables to the remediation process. In this case, what we want is the report of all customer account information from specific states with requirements to delete data after the retention period.
The traditional approach to build this is to use the result of the previous analytical use case (“tables with sensitive information not accessed in the last 6 months”) and build a pipeline that queries the tables, then filters out the data for specific states as stated by the retention policy, then sends data to BI tool. This process, although easy to implement, is not very resilient.
Let’s imagine what would happen if one of the table’s structures changed (e.g., we rename the columns or delete one of the columns used in the queries). Our data pipeline would break, and we would need to fix it.
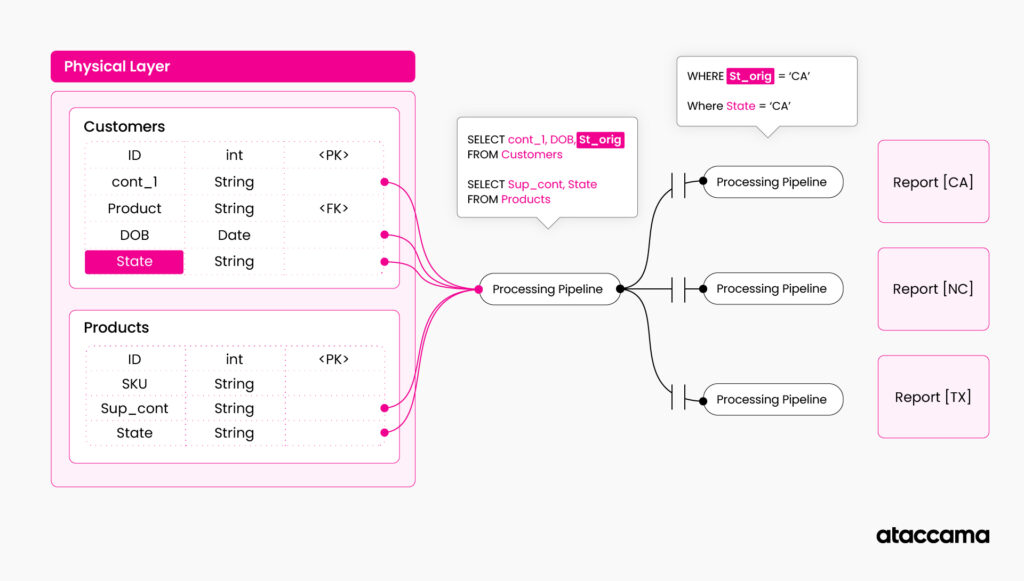
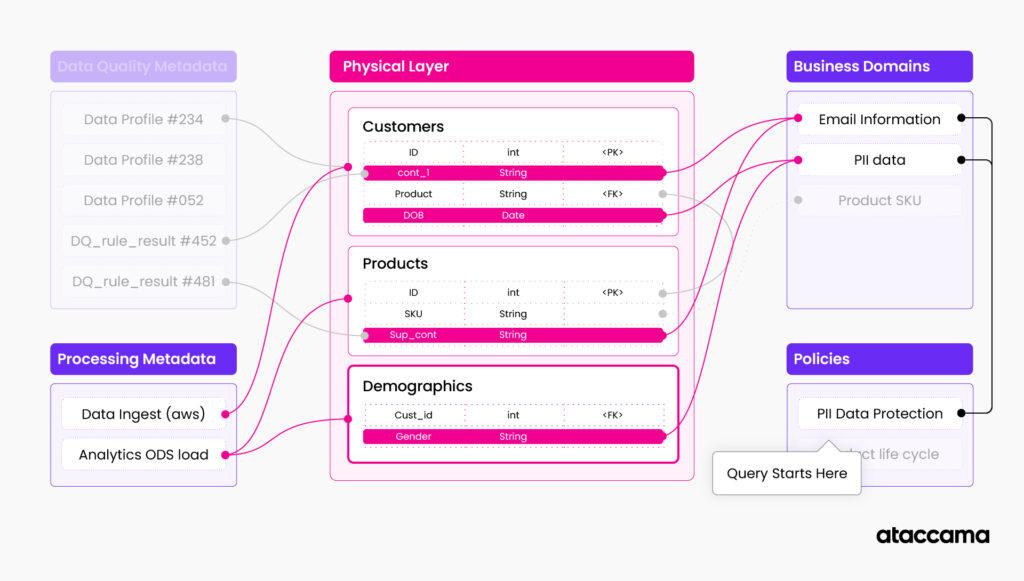
Even worse, what would happen if a new table with sensitive information appeared in my data landscape? We wouldn’t even notice that something is wrong, but our data pipeline would provide incomplete data.
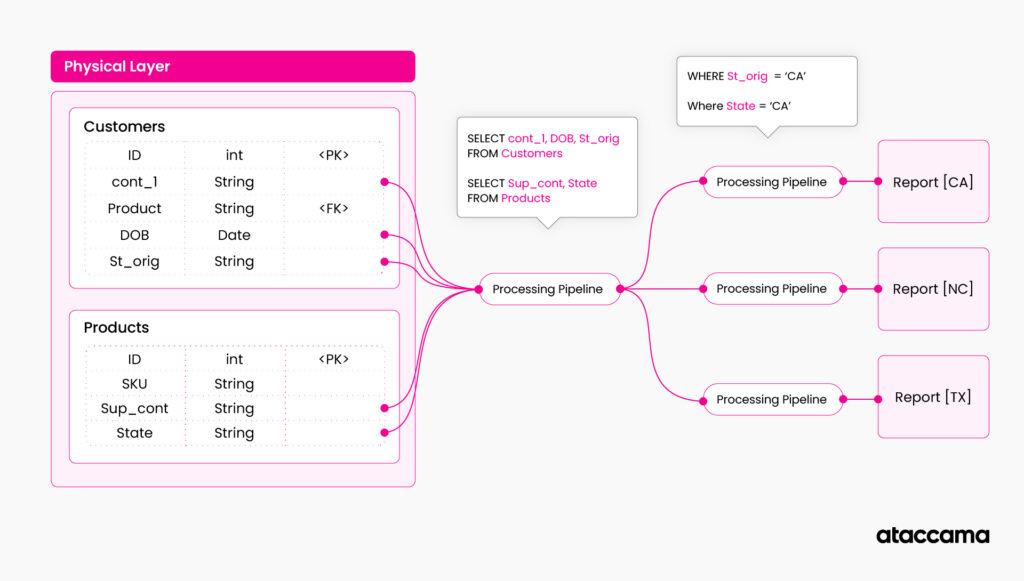
If we leverage a knowledge graph, we can make this process more resilient and self-correcting by incorporating graph queries directly into our data pipeline. The way to do this is to parametrize the configuration of your pipeline, and instead of specifying technical asset names when working with the data, specify their characteristics from the knowledge graph.
Example: instead of specifying “select STATE from table1,” you are saying “select (everything with the business term “[US] State”) from (any table with “[US] State” in it).”
The pipeline execution calls the underlying knowledge graph on runtime and configures itself according to results from the query search.
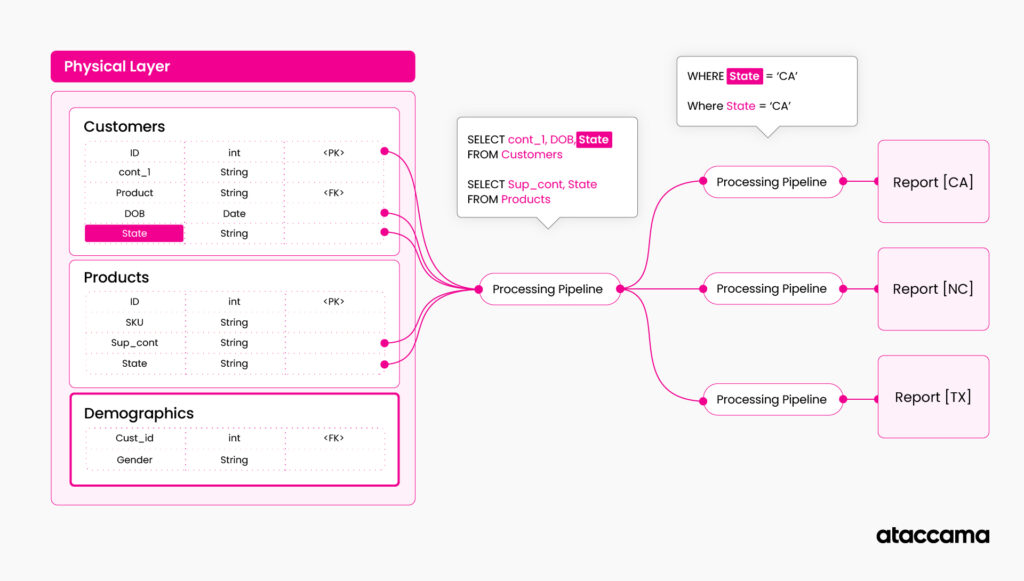
This way, you can create a data pipeline that does not break when there are structure changes. The pipeline will even update if the policy changes and more states add or change data retention requirements. The pipeline dynamically changes based on information in the knowledge graph.
After Change, the pipeline updates itself with a new table automatically:
For such an operational approach to work correctly, the underlying knowledge graph needs to have proper query options (ideally graph queries) and needs to be constantly updated and refreshed. Having a focus on automation is the key as much of the information in the graph can be automated automatically, and for logical domains maintained by subject matter experts (i.e., policy information), there should be a business process mandating the information review and updates on a regular basis.
Since knowledge graphs are quite complicated concepts, it is sometimes difficult to get the support and funding to build one. Focusing on benefits to business is often a good approach to getting attention and executive sponsorship for such initiatives.
What are the main benefits of knowledge graphs?
Data is what drives new business nowadays. The faster you can implement, test, and roll out new data initiatives, the more edge you gain against your competitors. Imagine building your new customer onboarding pipeline or e-shop experience in half of the time because your product team and developers can instantly identify, analyze, and use the data they need.
This also fosters a fast iterative approach, trying new initiatives, analyzing outcomes, and moving to the next one. Fail fast, move on.
When new regulations come in, implementation will take weeks instead of months. Many companies don’t even know where they have PII or medical data that is affected by the regulations, let alone how to correctly use that information in regulatory reporting. Having a knowledge graph and activating it for these purposes can speed up the process by an order of magnitude.
Imagine a data pipeline that does not break, for example, data onboarding from 3rd party sources that require a data quality check to be run every time new data lands in your warehouse. Instead of reacting and fixing it every time a provider decides to send the wrong file or change structure, the pipeline fixes itself, and your data engineers are free to work on new business initiatives.
Your data engineers, data scientists, and AI researchers are among the most expensive positions on the market right now. Imagine that your data engineers don’t need to spend half their time patching the broken data pipelines, or your AI researchers don’t have to spend most of their time searching for data and writing data transformations. This significantly lowers the time to value for your most critical projects.
In conclusion, activating knowledge graphs for data management applications offers a powerful way to enhance both analytical and operational processes. By unlocking the relationships between data assets, business metadata, and inferred connections, businesses can derive actionable insights, streamline compliance efforts, and build resilient, automated pipelines that adapt to changes over time. The ability to dynamically update data workflows based on real-time information from a knowledge graph provides an edge in speed, accuracy, and innovation.
The time to start leveraging the power of knowledge graphs is now. As data grows more complex, organizations need tools that can not only keep pace but also evolve with new demands. By investing in the right infrastructure, you can future-proof your data management strategies and empower your teams to focus on what matters most: driving business value and staying ahead of the competition.
Call to Action: If you’re ready to take your data management to the next level, begin by exploring how a knowledge graph can be activated within your organization. Start small with a proof of concept, and see how quickly it can transform your data initiatives into competitive advantages.
Marek Ovcacek is the Field CTO at Ataccama.
Cloud Data Insights is a blog that provides insights into the latest trends and developments in the cloud data space. We cover topics related to cloud data management, data analytics, data engineering, and data science.
Property of TechnologyAdvice. © 2026 TechnologyAdvice. All Rights Reserved
Advertiser Disclosure: Some of the products that appear on this site are from companies from which TechnologyAdvice receives compensation. This compensation may impact how and where products appear on this site including, for example, the order in which they appear. TechnologyAdvice does not include all companies or all types of products available in the marketplace.